For most common problems that are solved using machine learning, there are usually multiple models available. Each one has its own quirks and would perform differently based on various factors.
Each model is judged by its performance over a dataset, usually called the “validation/test” dataset. This performance is measured using various statistics - accuracy, precision, recall etc. The statistic of choice is usually specific to your particular application and use case. And for each application, it is critical to find a metric that can be used to objectively compare models.
In this article we will be talking about the most common metric of choice used for Object Detection problems — The Mean Average Precision aka, the mAP.
Most times, the metrics are easy to understand and calculate. For example, in binary classification, the precision and recall serve as a easy and intuitive statistic.
Object detection on the other hand is a rather different and.. interesting problem.
Even if your object detector detects a cat in an image, it is not useful if you can’t find where in the image it is located.
Since you are predicting the occurence and position of the objects in an image, it is rather interesting how we calculate this metric.
First, lets define the object detection problem, so that we are on the same page.
The object detection problem
By “Object Detection Problem” this is what I mean,
Given an image, find the objects in it, locate their position and classify them.
Object detection models are usually trained on a fixed set of classes, so the model would locate and classify only those classes in the image.
Also, the location of the object is generally in the form of a bounding rectangle.
So, object detection involves both localisation of the object in the image and classifying that object.
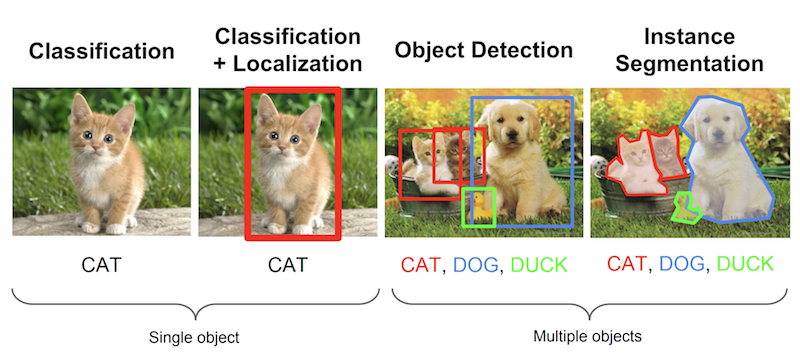 Image 1 - Few prominent Image Processing problems Image taken from Stanford’s CS231n Course slides(lecture 8)
Mean Average Precision, as described below, is particularly used for algorithms where we are predicting the location of the object along with the classes. Hence, from Image 1, we can see that it is useful for evaluating Localisation models, Object Detection Models and Segmentation models .
Evaluating object detection models
Why mAP?
Every image in an object detection problem could have different objects of different classes. As mentioned before, both the classification and localisation of a model need to be evaluated.
Hence, the standard metric of precision used in image classification problems cannot be directly applied here. This is where mAP(Mean Average-Precision) is comes into the picture. I hope that at the end of this article you will be able to make sense of what it means and represents.
About the Ground Truth
For any algorithm, the metrics are always evaluated in comparison to the ground truth data. We only know the Ground Truth information for the Training, Validation and Test datasets.
For object detection problems, the ground truth includes the image, the classes of the objects in it and the true bounding boxes of each of the objects **in that image.
An example
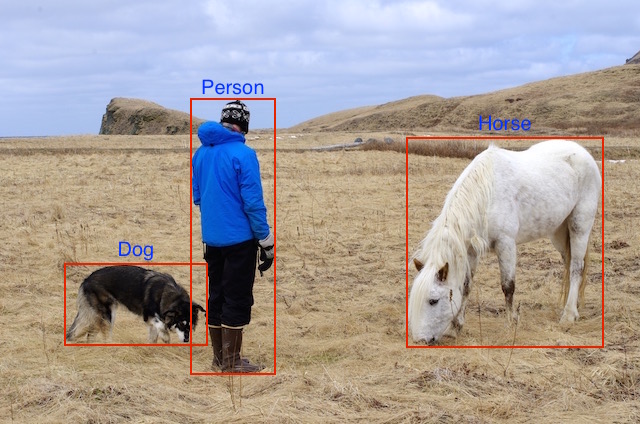 Human visualisation of the ground truth
We are given the actual image(jpg, png etc) and the other annotations as text(bounding box coordinates(x, y, width and height) and the class), the red box and text labels are only drawn on this image for us humans to visualise.
So for this particular example, what our model gets during training is this
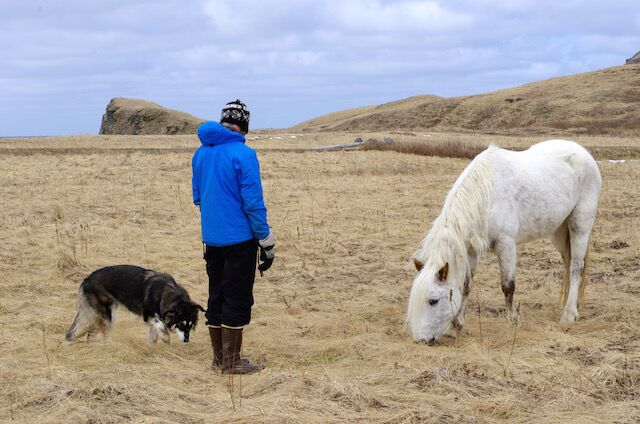 The actual image
And 3 sets of numbers defining the ground truth (lets assume this image is 1000x800px and all these coordinates are in pixels, also approximated)
| Class | X coordinate | Y coordinate | Box Width | Box Height |
|---|---|---|---|---|
| Dog | 100 | 600 | 150 | 100 |
| Horse | 700 | 300 | 200 | 250 |
| Person | 400 | 400 | 100 | 500 |
Lets get our hands dirty and see how the mAP is calculated.
I will go into the various object detection algorithms, their approaches and performance in another article. For now, lets assume we have a trained model and we are evaluating its results on the validation set.
Calculating the mAP
Let’s say the original image and ground truth annotations are as we have seen above. The training and validation data has all images annotated in the same way.
The model would return lots of predictions, but out of those, most of them would have a very low confidence score associated, hence we only consider predictions above a certain reported confidence score.
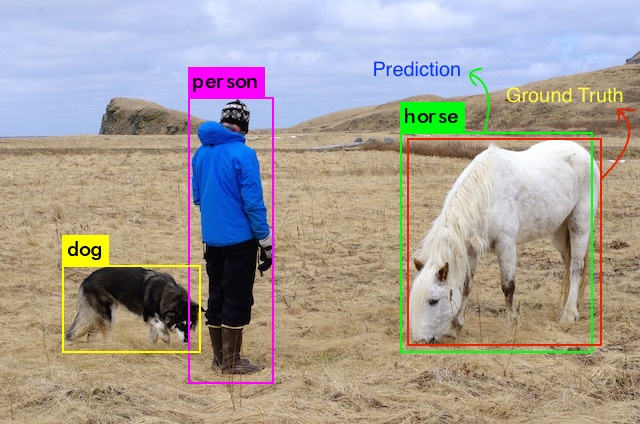
We run the original image through our model and this what the object detection algorithm returns after confidence thresholding,
Image with bounding boxes -
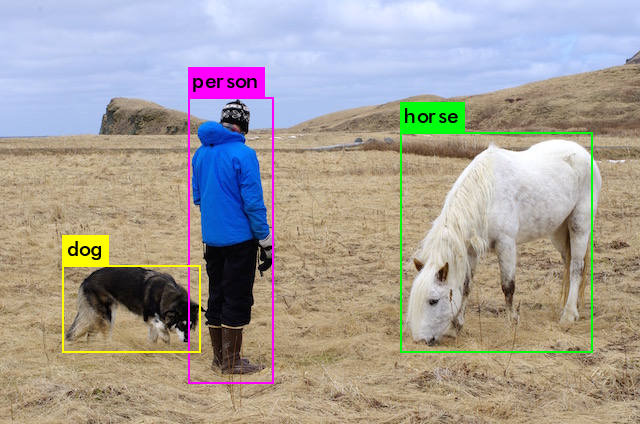 Results from our model
Now, since we humans are expert object detectors, we can say that these detections are correct. But how do we quantify this?
We first need to know to judge the correctness of each of these detections. The metric that tells us the correctness of a given bounding box is the - IoU - Intersection over Union. It is a very simple visual quantity.
In terms of words, some people would say the name is self explanatory, but we need a better explanation. I’ll explain IoU in a brief manner, for those who really want a detailed explanation, Adrian Rosebrock has a really good article which you can refer to.
IoU
Intersection over Union is a ratio between the intersection and the union of the predicted boxes and the ground truth boxes. This stat is also known as the Jaccard Index and was first published by Paul Jaccard in the early 1900s.
To get the intersection and union values, we first overlay the prediction boxes over the ground truth boxes. (see image)
Now for each class, the area overlapping the prediction box and ground truth box is the intersection area and the total area spanned is the union.
 We’ll show this example only for the horse
The intersection and union for the horse class in the above would look like this,
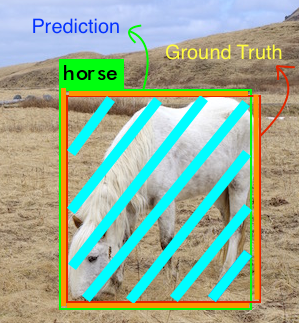 In this case the intersection is pretty large
The intersection includes the overlap area(the area colored in Cyan), and the union includes the Orange and Cyan regions both.
The IoU will then be calculated like this
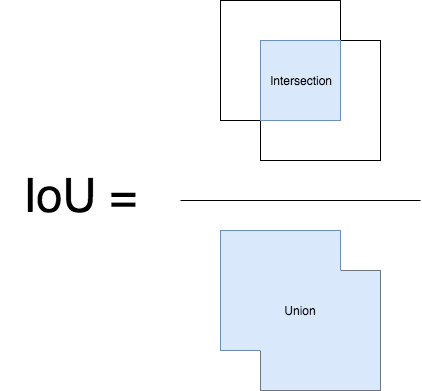 Image is inspired by the pyimagesearch article, which was inspired by University of Pittsburg’s CS1699 HW assignment4
Identifying correct detections and calculating precision and recall
For calculating Precision and Recall, as with all machine learning problems, we have to identify True Positives, False Positives, True Negatives and False Negatives.
To get True Positives and False Positives, we use IoU. Using IoU, we now have to identify if the detection(a Positive) is correct(True) or not(False). The most commonly used threshold is 0.5 - i.e. If the IoU is > 0.5, it is considered a True Positive, else it is considered a false positive. The COCO evaluation metric recommends measurement across various IoU thresholds, but for simplicity, we will stick to 0.5, which is the PASCAL VOC metric.
For calculating Recall, we need the count of Negatives. Since every part of the image where we didnt predict an object is considered a negative, measuring “True” negatives is a bit futile. So we only measure “False” Negatives ie. the objects that our model has missed out.
Also, another factor that is taken into consideration is the confidence that the model reports for every detection. By varying our confidence threshold we can change whether a predicted box is a Positive or Negative. Basically, all predictions(Box+Class) above the threshold are considered Positive boxes and all below it are Negatives.
Now for every image, we have ground truth data which tells us the number of actual objects of a given class in that image.
We now calculate the IoU with the Ground truth for every Positive detection box that the model reports. Using this value and our IoU threshold(say 0.5), we calculate the number of correct detections(A) for each class in an image. This is used to calculate the Precision for each class [TP/(TP+FP)]
Precision = TP/(TP+FP)
Since we already have calculated the number of correct predictions(A)(True Positives) and the Missed Detections(False Positives) Hence we can now calculate the Recall (A/B) of the model for that class using this formula.
Recall = TP/(TP+FN)
Calculating the Mean Average Precision
Using the Pascal VOC challenge evaluation metric
The Mean Average Precision is a term which has different definitions. This metric is commonly used in the domains of Information Retrieval and Object Detection. Both these domains have different ways of calculating mAP. We will talk about the Object Detection relevant mAP today.
The Object Detection definition of mAP was first formalised in the PASCAL Visual Objects Classes(VOC) challenge, which included various image processing tasks. For the exact paper refer to this. (backup)
We use the same approaches for calculation of Precision and Recall as mentioned in the previous section.
But, as mentioned, we have atleast 2 other variables which determine the values of Precision and Recall, they are the IOU and the Confidence thresholds.
The IOU is a simple geometric metric, which we can easily standardise, for example the PASCAL VOC challange evaluates mAP based on 50% IOU, whereas the COCO Challenge goes a step further and evaluates mAP at various threshold ranging from 5% to 95%. The confidence factor on the other hand varies across models, 50% confidence in my model design might probably be equivalent to an 80% confidence in someone else’s model design, which would vary the precision recall curve shape. Hence the PASCAL VOC organisers came up with a way to account for this variation.
We now need a metric to evaluate the models in a model agnostic way.
The paper recommends that we calculate a measure called AP ie. the Average Precision
For a given task and class, the precision/recall curve is
computed from a method’s ranked output. Recall is defined
as the proportion of all positive examples ranked above a
given rank. Precision is the proportion of all examples above
that rank which are from the positive class. The AP summarises
the shape of the precision/recall curve, and is de-
fined as the mean precision at a set of eleven equally spaced
recall levels [0,0.1,...,1]:
This means that we chose 11 different confidence thresholds(which determine the “rank”). The thresholds should be such that the Recall at those confidence values is 0, 0.1, 0.2, 0.3, … , 0.9 and 1.0. The AP is now defined as the mean of the Precision values at these chosen 11 Recall values. This results in the mAP bieng an overall view of the whole precision recall curve.
The paper further gets into detail of calculating the Precision used in the above calculation.
The precision at each recall level r is interpolated by taking
the maximum precision measured for a method for which
the corresponding recall exceeds r:
Basically we use the maximum precision for a given recall value.
The mAP hence is the Mean of all the Average Precision values across all your classes as measured above.
This is in essence how the Mean Average Precision is calculated for Object Detection evaluation. There might be some variation at times, for example the COCO evaluation is more strict, enforcing various metrics with various IOUs and object sizes(more details here). If any of you want me to go into details of that, do let me know in the comments.
Some important points to remember when we compare mAP values
- mAP is always calculated over a dataset.
- Although it is not easy to interpret the absolute quantification of the model output, mAP helps us by bieng a pretty good relative metric. When we calculate this metric over popular public datasets, the metric can be easily used to compare old and new approaches to object detection.
- Depending on how the classes are distributed in the training data, the Average Precision values might vary from very high for some classes(which had good training data) to very low(for classes with less/bad data). So your mAP may be moderate, but your model might be really good for certain classes and really bad for certain classes. Hence it is advisable to have a look at individual class Average Precisions while analysing your model results. These values might also serve as an indicator to add more training samples.